


 8 min read
In this article, we consider how identity impacts the level of salary available. We analyse the results of our customer marketing salary survey to consider how average salaries is impacted by disability, ethnicity, and sexual orientation.
We first look at whether hours worked and having subordinates have a bearing on salary earnings.
Managing other employees
The first area we looked into was whether or not managing a larger number of employees has any bearing on the base salary awarded. We asked our survey responders whether they managed any employees, and how many they managed.
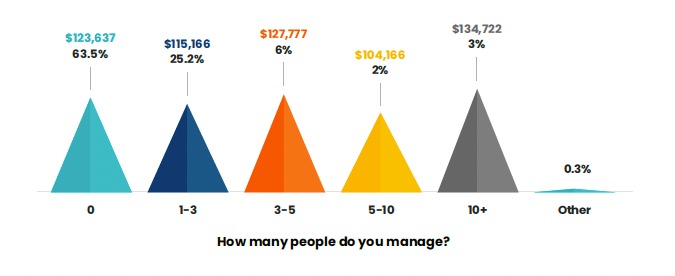
While the assumption may be that those who manage more employees (and, therefore, have more responsibility) have a higher base salary, our data doesn’t quite reflect this.
The highest average salary came from those who manage over ten employees ($134,722), with the second highest being those that manage 3-5 employees ($127,777).
Where the assumption doesn’t correlate is with the other ranges. The next highest average salary shown in the graph was from those who don’t manage any other employees. It’s also important to note that out of this group the majority of responders, 36%, are working solo.
Smaller teams, teams of two to five people, were among the most common, making up a combined 36.2% of answers. 24.3% of customer marketers surveyed came from one-person teams. This will be explored further in section nine of this report.
Note: It is worth considering that, due to the small sample sizes for some of the answers represented, the averages above may not be indicative of the global whole, but are representative of the group we surveyed.
Hours worked per week
Again, when we look at the correlation between salary earnings and hours worked, there was not an accurate correlation between our assumption of the connection between hours worked and the salary awarded.
The band with the highest average salary was the one that said employees work 30-40 hours, with an average of $127,648, which is $2,202 more than those that work 50+ hours, and $9,306 more than those working ‘full-time’ hours (40-50 hours), which made up the largest percentage of answers at 60.8%.
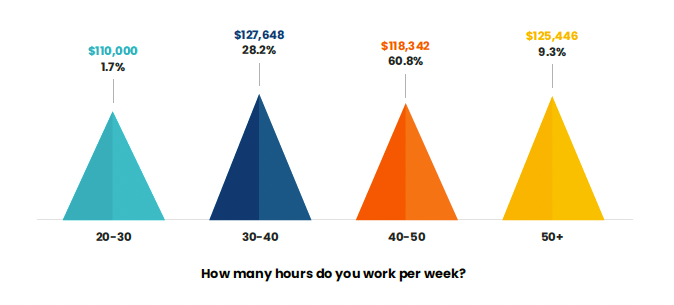
Those who work 50+ hours a week earn the second most with an average salary of $125,446, 2% higher than the global average.
Of those who worked 50+ hours a week, marketers based in North America earned 1% more than the average, while those from other parts of the world earned 4% less than the global average.
Outside America, these working hours should be reflected in a higher salary.
Diversity, equity, and inclusion
The impact of social discrimination in the workplace is a subject hotly debated in recent years.
We wanted to see how much of a bearing social discrimination had on salary. We consider the disparity between men and women, white people and people of color/ethnic minorities, and those with and without disabilities.
Pay and gender
Interestingly, 75.8% of our respondents identified as female. While there isn’t a lot of data currently available for gender disparity in the customer marketing profession specifically, looking at similar positions, customer marketing is unique in its female-identifying majority.
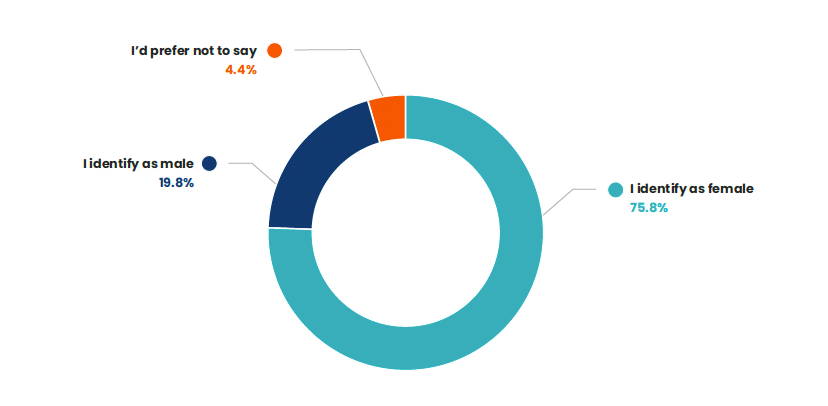
While our survey did provide options for other gender identities, we did not receive responses from people who identified as outside of the two gender identities listed or who were willing to submit that information.
Though we didn’t have any respondents select other gender identities, it bears consideration that customer marketing is a position in need of more LGBTQ+ representation. The customer marketing community must be representative of those that make up their audience, in order to best understand and address their needs.
Average salaries
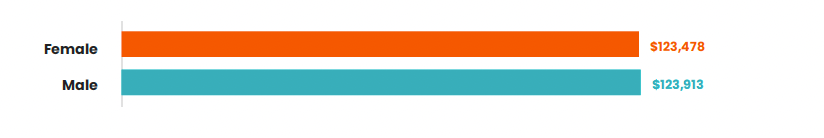
Interestingly, the average salaries for male and female customer marketers go against the trend, with the average for female customer marketers being about 5% higher than the average salary for males.
The male average was also about 5% lower than the global average, compared to the female average which is slightly higher than the global average.
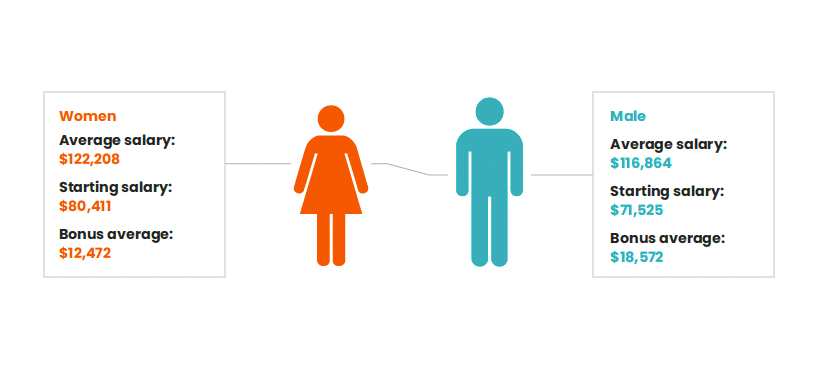
The disparity comes when we look at the average yearly monetary bonus, which female customer marketers receive significantly less than their male counterparts, especially in comparison to the relatively even current and starting salary averages.
Male customer marketers get an average bonus of $6,100 more than their female counterparts per year. This may explain the difference in salaries and may indicate that male customer marketer earnings rely more on bonuses than on a baseline salary.
Gender and location
Digging deeper, we broke down the average male and female salary by location too. Asia, Australia, and Europe followed the trend above, with their female customer marketers earning more than their male counterparts.
But, for North America, female customer marketers earn a slightly lower average salary than male ones.
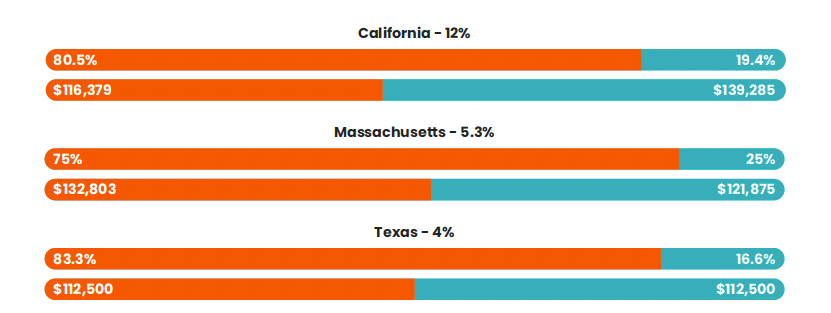
Breaking it down further into states, we found that the states with the most disparity were California, Colorado, and New York. For each of these three states, female customer marketers make up around 80-90% of our data pool.
And yet, for each state, females make less than the male average:
- For New York, female customer marketers make 61.8% of the male salary for their state.
- For Colorado, female customer marketers make 92.2% of the male salary for their state.
- For California, female customer marketers make 83.5% of the male salary for their state.
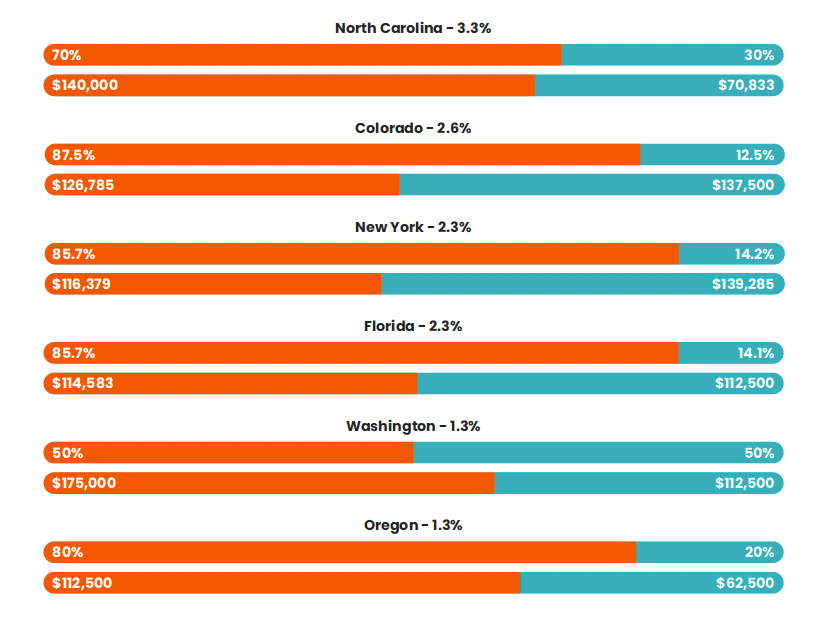
Female customer marketers had a higher earning average than their male counterparts within the other states in our data pool.
That being said, it’s important to note that these numbers and percentage differences reflect our data pool for this report, rather than the total population of customer marketers for each state.
Note: Georgia and Washington were omitted from this data pool as they were only represented by female customer marketers.
Pay and ethnic minorities
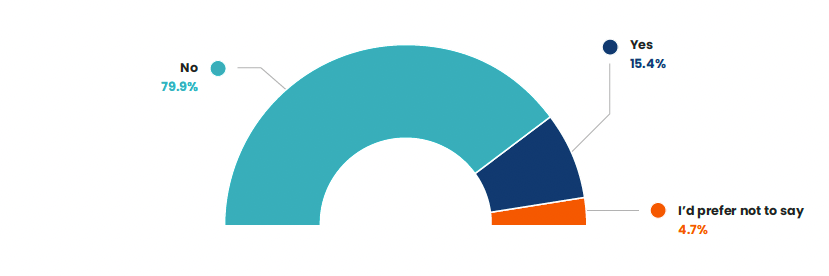
Of the people we surveyed, 15.4% considered themselves part of an ethnic minority. The majority hailed from North America (82%), with the remainder, 18%, coming from Europe.
Average salary
Interestingly, those who are part of an ethnic minority in our data pool have a higher average salary ($132,065), with those who don’t consider themselves a part of an ethnic minority earning slightly less ($118,686).
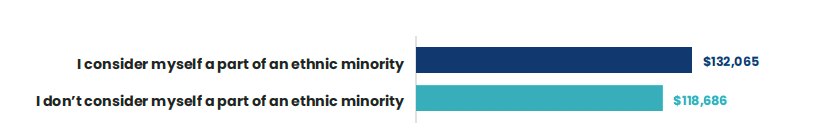
It’s good to see that there isn’t much of a difference when it comes to average salaries. However, this is likely because of the uneven distribution of the data, given that only 15% of our data pool do consider themselves a part of an ethnic minority.
Note: When we broke down the results by location (and by state for participants in North America), the results followed the trend for the global average.
Pay and the LGBTQ+ community
Of the people we surveyed, only 6.7% identified as part of the LGBTQ+ community; the vast majority do not (89.6%).
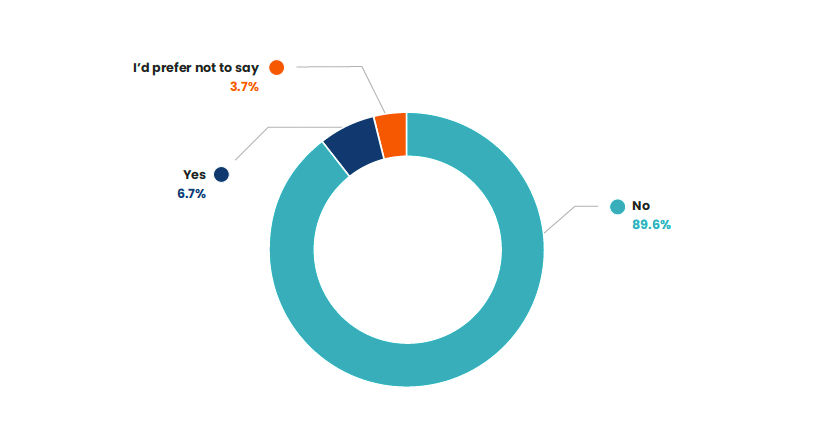
When compared to the percentage of those that identify as LGBTQ+ in the general population, this number is relatively similar. In the US, LQBTQ+ make up about 7.1% of the the general population. There is a slightly higher average when surveyed globally, with around 10% identifying as something other than heterosexual.
This shows that there is a good representation for LGBTQ+ in customer marketing positions, but could also be a little higher to be more indicative of the global average.
Average salaries
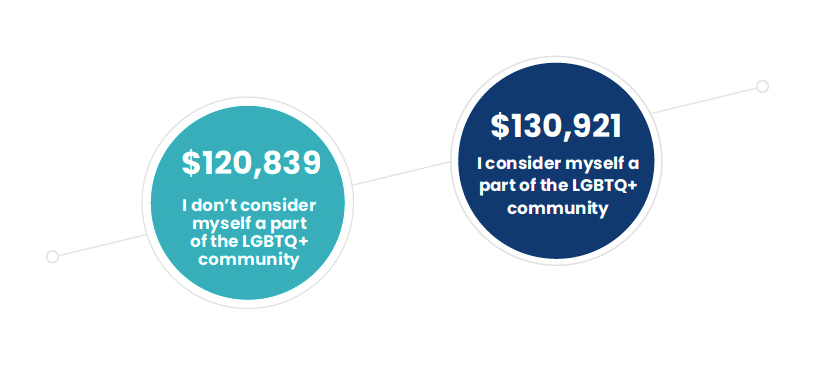
The average salary rate for those in the LGBTQ+ community was higher than those who weren’t part of this community, but slightly lower than those who identified as part of an ethnic minority.
Pay and disability
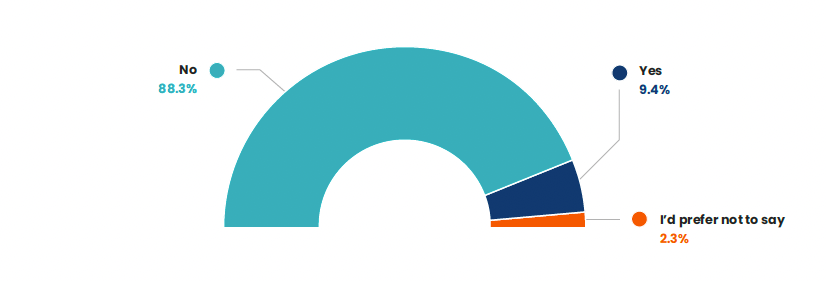
Out of our group of respondents, 9.4% said they had a disability of some kind (either invisible or physical), with 88.3% saying they didn’t.
Average salaries
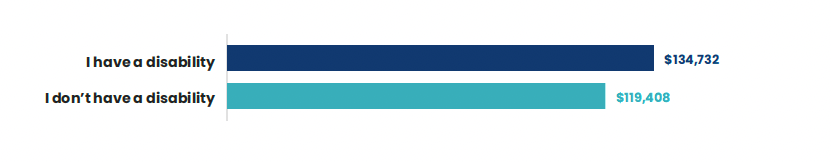
As shown in the graph above, the salary average is higher for those with a disability than those without.
It’s encouraging to see that the equal pay is observed for those in customer marketing positions. At base pay, our data shows that customer marketing positions do not award salaries based on preconceived biases.
However, the overall representation of these groups could be much higher. POC, LQBTQ+, and those with disability, only make up about 30% of our data pool.
Pay and higher education
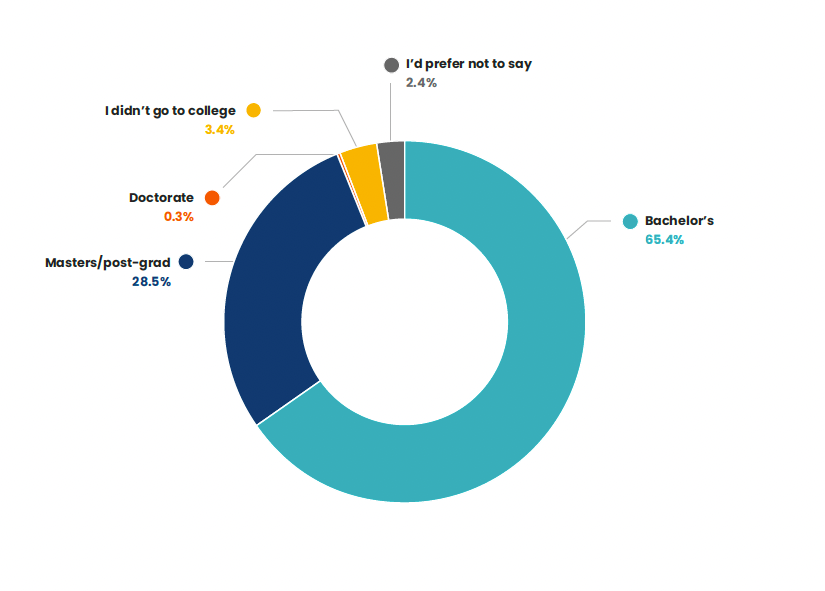
From our data pool, the majority of our responders have the higher education level of a Bachelor’s degree (65.4%), with those that have achieved a Masters/other post-graduate degree coming in second (28.5%). Only 3.4% of our respondents didn’t go to college.
Average salaries
As with the other factors in this section, the assumed trend, this time being the higher the education level, the higher the average salary, doesn’t fit with our data.
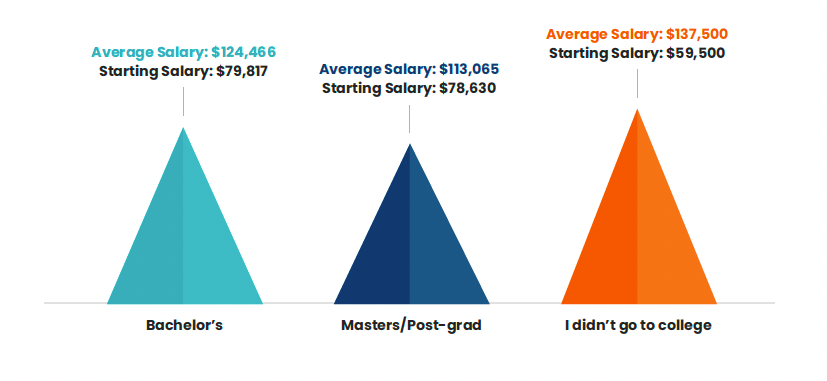
As with the others, it’s important to consider that the data pool disparities between the different sections will have an impact on the end result; however, it’s interesting that, even though we had a decent representation of Masters/post-graduate participants, their overall average salary was lower than those with a Bachelor’s.
When we look at starting salary, however, the trend is more like what we’d expect, with those that didn’t go to college beginning their customer marketing career with a lower starting salary when compared to the others.
This can not be said of those with Master’s or post-graduate qualifications, who began with a lower starting salary than those with a Bachelor's degree.
Experience vs education
However, this can perhaps be explained by the factors in the following section, specifically years of experience.
We’ll go more into detail in the next section, but when comparing education and years of experience, we found that those with a Bachelor’s degree had more years of experience in customer marketing itself than those with a higher degree.
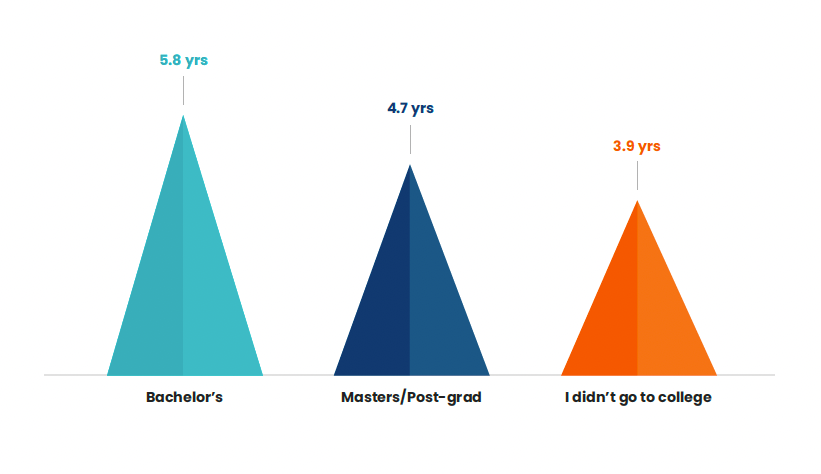
This may be because these participants are entering the workplace earlier, and therefore, have a chance to garner experience in other areas of the industry first, resulting in a higher starting salary when they do turn to customer marketing.
Get the full report
This article was a sneak peek into Customer Marketing Alliance's Customer Marketing Salary Report, sponsored by Influitive. 🎉
Delve into the deep-cut analysis of the factors currently impacting wage levels, and stay in the know about how much your experience and position are worth.
Get your free copy below. 👇


Customer marketing insider
Thank you for subscribing
Level up your customer marketing skills and connect with experts worldwide.
An email has been successfully sent to confirm your subscription.
 Follow us on LinkedIn