10 min read
2022 saw our very first State of Customer Marketing Report, which went over a variety of different topics related to the position. This article serves as a sneak peek into the report and our conversations with our community members and survey responders. It’ll cover:
- Responsibilities and value drivers in customer marketing,
- Customer advocacy program and contact with customers, and
- Team and stakeholder metrics.
Responsibilities
A customer marketer’s core responsibilities are tied to improving customer retention. As such, the majority of customer marketing responsibilities are program management (33.3%) and customer feedback collection (33.3%). In a distant second are customer conferences & events (11.2%), with cross-selling/upselling bringing up the rear (7.4%). We also have messaging, and ‘Other’ making up 3.7% of answers each.

Responsibilities that were mentioned in the ‘Other’ section include references, networking, and customer advisory boards.
Program management requires a lot of collaboration with the customers involved. To get a better understanding of customer feedback, and which ones are the best for the kinds of information you want, get more in-depth information with Laura Culbertson’s article.
 Lauren Culbertson
What are the biggest value drivers for businesses?
When we broke down what the biggest value drivers are for customer marketers and their business, the highest was customer advocacy/ambassador program management at 33.3%. This was followed by case studies and success stories (14.8%), and customer advisory boards (11.1%).
This is mostly consistent with the highest percentage of responsibilities, that of program management and customer feedback. Customer conferences and events also came in similar positions for each collection of answers.
Taking into consideration the fact that advocacy programs are prevalent as both key tasks for customer marketers and big value drivers for businesses as a whole, it’s no wonder that many consider it to be the part of customer marketing that’ll be the most valuable within the coming year.
“As you grow the customer marketing function in your organization, I would encourage you to organize your team to have someone focused on managing scaled customer programs and supporting higher-volume internal requests (e.g., sales references, product feedback) and another person focused on managing high-touch customer programs (e.g. CABs, executive councils) that help you building relationships with your most strategic customers and driving impactful advocacy (e.g. keynote, success story) with them.” - Erica Anderson, Vice President of Practice Management, Influitive
Kevin Lau, Senior Director of Customer Advocacy & Engagement at F5, gave us a glimpse behind the scenes on our podcast, Customer Marketing Catch-up, on the essential tenets he ascribes to in order to instantly elevate his advocacy programs.
Customer Advocacy
With customer advocacy being such an important part of customer marketing, we delve deeper into what current organizations have set up in terms of supporting customer marketers that turn loyal customers into advocates.
When we asked participants, “Do you have a customer advocacy program?”, it was positive to see that 39.3% of respondents said yes. The majority of respondents answered that they were in the process of creating an advocacy program (50%), with only 10.7% answering no.
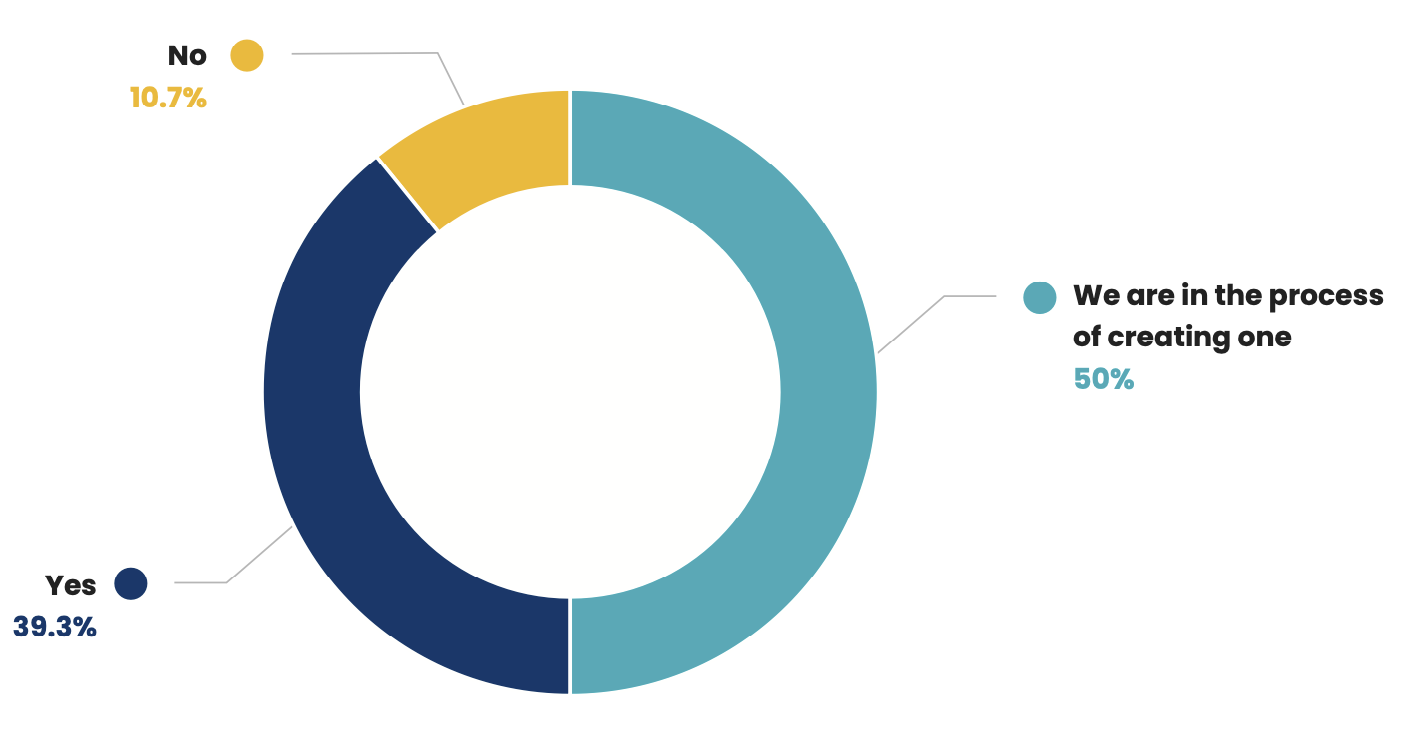
As you can see, 89.3% of our respondents either have, or are about to have a customer advocacy program. This supports what our contributors said. With just over half of our respondents in the process of creating an advocacy program, we’ll see an increase in the number of companies that have invested in advocacy programs.
We delved deeper into those that said they already have an advocacy program in place, to see what impact their program has made on their business and how they manage their program.
How are advocacy programs managed?
There are a lot of tools out there that can be utilized by customer marketers, which optimize and automate a number of different tasks that customer marketers are involved in. We wanted to know if this was the case with advocacy programs.
Looking at the results of how our respondents manage their programs, it seems that there isn’t one unified approach yet. The highest percentage at 37.5% was manual tracking, followed by customer management tools (33.3%), and spreadsheets (29.2%).
It seems that, currently, management tool vendors are not supplying the right kind of tools for those tracking advocacy. As advocacy increases in scope and importance in the coming year, it’ll be interesting to see if this need gets addressed.
We asked those that used management tools to clarify which they were using. The most frequent answers included Influitive, Salesforce, and Crowdvocate. Other answers included HubSpot, Vitally, Gainsight and SlapFive.
“Customer marketing is often measured by customer retention. However, since customer retention is shared with CS and a lagging metric, I encourage customer marketing teams to look at leading indicators of customer health (e.g. NPS, product usage) compares for program members vs. non-program members. Then, make sure to track requests and outcomes for the use cases they’re supporting (e.g. reference calls, success stories).” - Erica Anderson, Vice President of Practice Management, Influitive
Impact of an advocacy program
Next, we wanted to see where companies found advocacy had the biggest impact. Around half of our respondents said that, with the introduction of their advocacy program, they saw an increase in case studies (52.9%).
This would make sense, as advocates are customers who aren’t just loyal to your business but actively help promote it to others. Case studies are a great way to do this as they’re useful for marketing and sales pitches. Case studies show your product working for others to help reassure prospective customers that you’re worth it - it’s a classic case of social proof working in action.

The next highest factors that advocacy programs impacted were an increased Net Promoter Score (17.7%) and increased referrals and cross-selling/upselling making up 11.8% of answers respectively.
Net Promoter Score is a score that determines the likelihood of customers recommending your product or services to others. This, alongside increased referrals, shows that those with customer advocacy programs have a higher likelihood of customers coming to their site under the recommendation of others.
Forbes maintains that customers acquired through referrals have a 37% higher retention rate than those without. Many companies are still holding onto the fact that customer acquisition is more of a priority than retention. But an increase in referrals that turn into loyal customers shows how much more important retention is.
Without advocates shouting your name from the rooftop, the harder it’ll be to successfully acquire and retain new customers.
Those that answered ‘Other’ stated increases in things like win rates, development, awareness, and market leadership.
How many customers are advocates?
Considering the impact of advocacy programs, we wanted to get an idea of how much of their existing customer base was made up of advocates. The ideal scenario would have every customer be an advocate for your business, but, since this is an unrealistic goal, getting an understanding of the current percentages of advocates can give us a starting point.
Overall, the majority of our participants stated that 5-10% of their existing customers were made up of advocates (41.6%). The next highest categories were 0-5%, and 15-20%, both making up 16.7% of answers respectively. The 10-15% and 25-50% range came in lowest, making up 12.5% of answers each.

It’s important to note that there was a difference in advocate percentages between the companies that do and don’t currently have an advocacy program in place. The average answer for those that said they did have a customer advocacy program rose from the average 5-10% to the most common answer being in the range of 15-20%.
Having a 5-10% range of advocates is nothing to scoff at, but it would be good to see an overall increase for customer marketers as a whole, especially as only 29.2% of respondents cited their company advocates making up 15% or more of their existing customer base. With so many companies currently in the process of creating an advocacy program, we’ll hopefully see the average percentage increase within the year.
Eve Chatfield
Contact with customers
With this in mind, we wanted to know how often customer marketing teams interact with customers. Customer marketing is a role in which feedback and communication from customers is vital.
It was interesting to see that the two most common answers were 2-3 times a week (22.2%) and a handful of times a month (22.2%), which is a big difference. Following up these answers were once a week (18.5%), every other week (14.8%), and every day at 11.2%.
When comparing the number of advocates with how often companies maintain contact with their customers, we found that those with the highest percentage of advocates, 15-20% and 25-50%, had contact with their customers each week. This ranged from every day to once a week. Overall this shows what we already know to be true: that valuing the customer-business relationship increases customer loyalty.
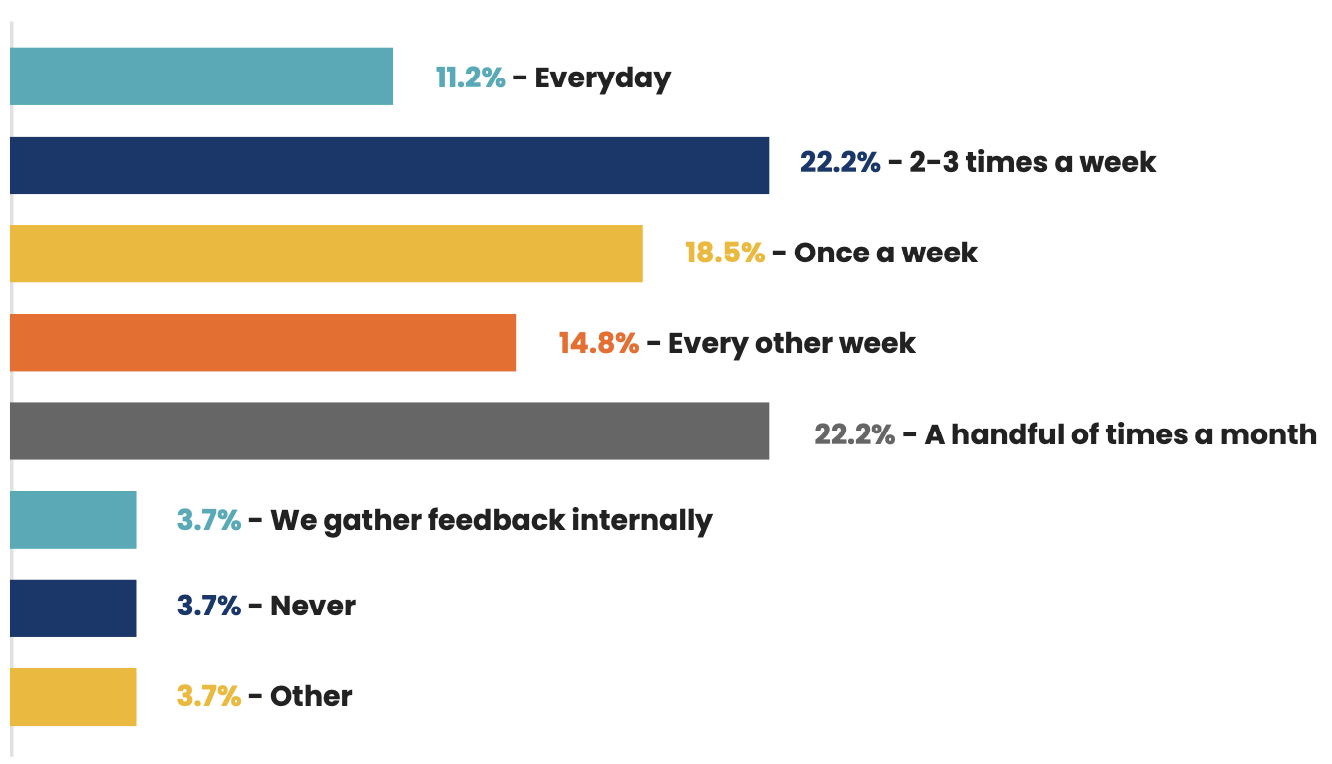
It’s good to see that only 3.7% of respondents said that they never speak to customers, but this could be even lower. To carry out those big-value tasks mentioned earlier, you need to have customer insights.
Those that selected ‘Other’, cited interacting with customers once a month, quarterly, or a couple of times a quarter.
Customers are the ones who interact with your business most often; they’re the ones going through the customer journey and no amount of internal feedback or guesswork will ever equal the value of getting that first-hand customer experience.
The more frequently you interact with your customers, the more up-to-date your information will be. That way, you can help anticipate changes in your clientele and the market, and address any pain points and issues before they become big enough to cause churn.
Team metrics
We asked our participants, “What metrics does your team use to measure your efforts?”. As so much of customer marketing is relationship-based, it can often be hard to accurately measure the performance of this type of team.
Here’s an in depth review of the common team structures in customer marketing in 2022:
Eve Chatfield
Out of our respondents, 34.6% said they measured their efforts by acts of advocacy. This is in line with the 40% of respondents that said they had an advocacy program. But what about those that don’t?
It seems that the metrics chosen to measure performance are yet again quite divided. Renewal rate was the next highest percentage wise at (19.2%). Then, at a significant dip, churn rate and number of testimonials make up 7.7% of answers each.

Answers when participants selected ‘Other’ included upselling, opportunity and revenue metrics, pipeline influence, Marketing Qualified Lead (MQL), and Net Dollar Retention.
Surprisingly, 7.7% of respondents said they don’t use metrics at all. We asked Kevin Lau, Senior Director of Customer Advocacy & Engagement at F5, about why this might be. He said:
“The one area where Customer Marketing professionals struggle the most with is effectively proving ROI and impact to their leadership teams. It’s not anyone’s fault - we have always been taught to focus on the relationship with the customer first and worry about the hard numbers later.
This is why demand teams historically have received the majority of marketing team budgets and resources - everything they do is measured and tracked back to pipeline and opportunity influence. In the meantime, we as Customer Marketers are having to play catch-up as we figure this out. Until we have the tools, resources and budgets to do this holistically, it’s going to take some time.”
Metrics for stakeholders
When considering which metrics would be most useful, not necessarily for measuring performance, but ones stakeholders find most valuable, we saw an interesting change in answers.
This time, churn rate (18.5%) and renewal rate (18.5%) took top spots, with acts of advocacy (11.1%) and number of case studies (11.1%) coming in at more distant seconds. Net Promoter Score (7.4%) and number of testimonials (7.4%) came joint third.

It’s interesting to note that, though most teams don’t use churn rate as a metric for measuring their performance, it’s acknowledged to be an important rate for stakeholders. There seems to be a divide between customer marketers and their collaborating members.
Perhaps this indicates a larger issue with how those outside of customer marketing understand and value it. Hopefully, we’ll see a unification of metrics and how the customer marketing profession is monitored over the coming years.
Want to read more?
This article is a sneak peek into our State of Customer Marketing Report for 2022.
You can download the full report using the form below and unlock 70+ pages of unique insights into the current state of customer marketing and how it fits in with the rest of the market.


Customer marketing insider
Thank you for subscribing
Level up your customer marketing skills and connect with experts worldwide.
An email has been successfully sent to confirm your subscription.
 Follow us on LinkedIn