


 10 min read
Welcome! My name is Eric Keating, and I'm here to talk about product adoption – both how to use it to create organizational alignment and focus, and how effective that can be at getting ahead of churn and boosting revenue.
Before we get into it, let’s take a look at what this article will cover.
- My background and role at Appcues
- What product adoption is and why it's important
- How to build a product adoption score (PAS)
- Appcues’ first PAS
- Putting your PAS into action
- How Appcues uses PAS
- The results so far
My background and role at Appcues
For some context, I head up marketing at Appcues. Appcues makes it easy to measure and improve product adoption without a developer. Our users are largely non-technical, and they're using Appcues to track product usage and publish highly effective in-app onboarding tours, announcements, and surveys all in a matter of minutes.
As for me, I’ve spent the last 15 years or so in SaaS marketing, growth, and GM positions, and for the last two years, I've been at Appcues, where I'm helping SaaS businesses solve product-led problems. We're also using a product-led strategy ourselves, so I’m very immersed in that world. My team owns customer acquisition as well as self-serve customer expansion and retention, and that's a pretty big part of our customer base.
What product adoption is and why it's important
First, I want to talk about product adoption, what it is, and why it’s important. Product adoption is the process of new users learning about, choosing, and using your product more deeply and more frequently over time. Ultimately, it's about maximizing the value that your product delivers to your customers.

I'm going to unpack that quite a bit today, but first, let me tell you why it's so important. To start, successful product adoption is an early indicator of retention. Every company I've worked at has had a retention or churn target and we've always paid a ton of attention to it – I'm sure that's true for everybody reading.
You can probably relate to hearing something along these lines: “Oh, no! This customer comes up for renewal in 90 days. We've got to jump on this to make sure they stick around ASAP!” The problem is that churn is the last thing that happens. It's an outcome. While you may be able to save an at-risk customer with 90 days of intense focus, it's not a sustainable or scalable approach and I'm sure we'd all like to avoid that.
Successful product adoption also drives expansion revenue. Upgrade and expansion revenue are so important. Everybody reading this is probably thinking more about net retention today than they ever have before.
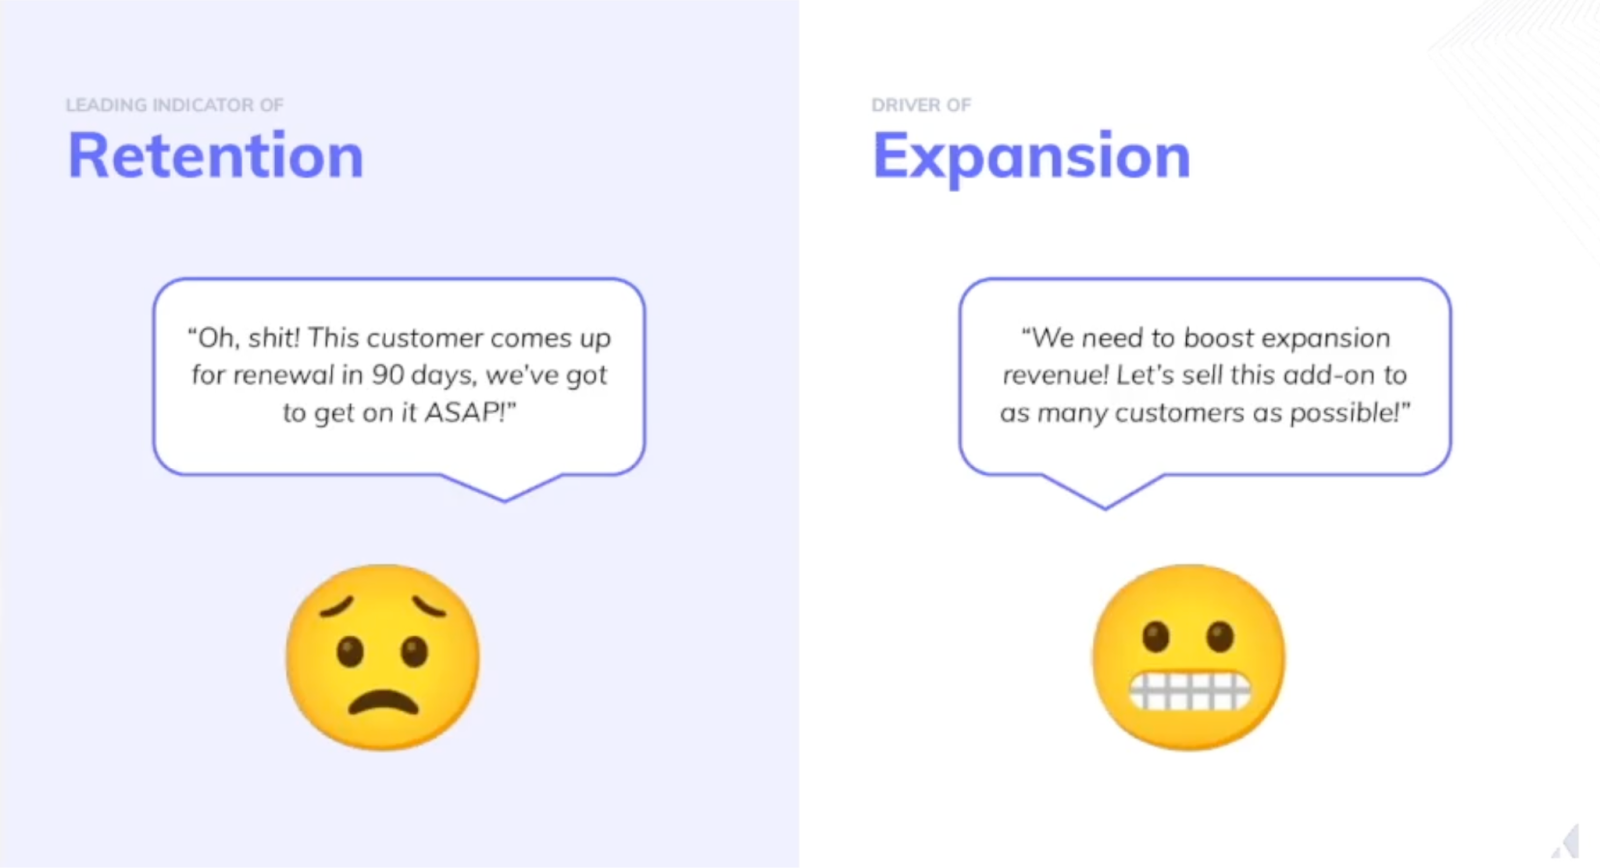
Similar to the retention side, you've probably heard something like, “We need to boost expansion revenue this month! Let's run a campaign and try to sell this add-on to as many customers as we can.” Again, it's totally reactive and unscalable and often requires a ton of work.
There's a lot working against us with our churn and retention targets. You might be sick of seeing this, but for dramatic effect, let’s take a look at the latest Martech 5000, which is actually closer to 10,000 these days, and that’s just marketing technology. There's more competition in the market than ever, and the cost of switching to a new vendor is the lowest it’s ever been. We're seeing that across the board.

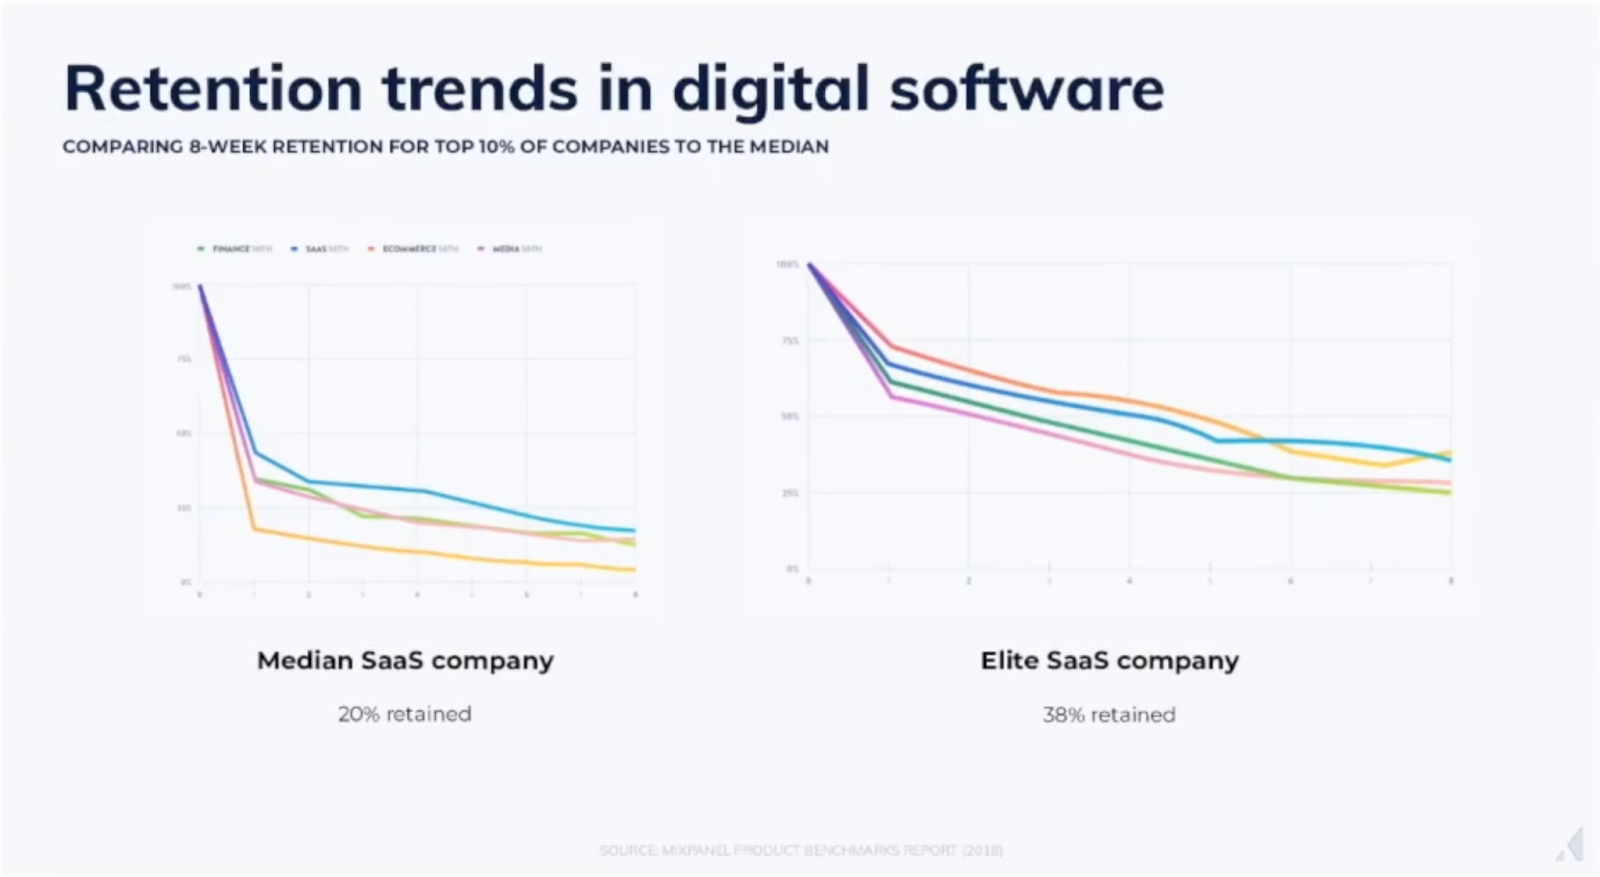
On top of that, Mixpanel’s Product Benchmarks Report shows that average retention rates are super low, and for many of us, they're declining. And then, to make matters worse, buyers’ preferences are evolving. They have higher standards for product experiences, more consumer-like expectations, and a strong preference for self-service. Those preferences are driving shifts in go-to-market strategies
Think about how much the buyer’s role in digital products has changed. Once upon a time, there was a whole process before users started using your product. Now, it's way more common for people to start a trial or get the freemium version of your product before they decide to buy. All that without talking to anybody at your organization.
Looking at it this way, it's easy to see just how much more important it is to show the value of your product quickly and ensure users are adopting it early on.
All that is to say that aligning on product adoption is the best way to overcome these challenges, get ahead of churn, and boost revenue. It's not the only way, but I think it's one of the most effective ways to do it.

When you've got users who are more invested in your product, and your product is more ingrained in their day-to-day, that's not only going to maximize the value you're delivering, it's also going to create happier and more satisfied customers. That means it’s going to be a lot easier to justify the renewal when the time comes. They’re also going to be more receptive to expanding. In addition to that, it's going to be more difficult for them to switch to another product.
I'm going to tell you how to improve product adoption, reduce churn and boost revenue, but before I do, I want to make it clear that product adoption is not a goal that you can achieve. Your product is always changing as you introduce new features, refresh your UI, and respond to your customers' evolving needs. You can’t just check a box and say adoption is done, but it can be observed, measured, and improved. That’s what we're going to look at now.
How to build a product adoption score
The product adoption score is a metric used to understand and measure customers' adoption of your products, relative to the ideal state.

You may have heard of customer health scores; you may even be using them. Before I go on, I want to make it clear that product adoption scores and customer health scores are not the same.
I'm not advocating for one metric over the other, but it’s worth noting that customer health scores usually take into consideration qualitative data about your customers' businesses, like if a champion has left the organization. While that can inform actions for customer success or sales, there's not a lot that marketing or the company at large can do with that information. The PAS focuses on hard numbers and clear actions you can take across the company.
Let's talk about how a product adoption score breaks down and how you can create one. The key is identifying behaviors and usage patterns that correlate with retention. I’ll break this down into four steps.
Step one: Start by identifying your best-retained customers. Don't rely on contract value, case studies, or even NPS. You want to look at retention rates. When we did this, we looked at the correlation between NPS and retention and found that there was very little, if any, which was surprising.
Step two: Take note of the behaviors and usage patterns your best-retained users have in common. Which features are they using? How often are they logging in? There are all sorts of ways you can look at it, but you want to find those commonalities.
Step three: Check for and remove bias. Survivorship bias is common here, so compare whatever patterns you identify against other current and churned customers and perhaps do a regression analysis. We had our business intelligence and ops teams helping with this.
Step four: Hone in on the strongest correlations and use them to design your scoring model. Each of these behaviors and patterns will have different strengths of correlation, so you’ll need to apply different weighting to each lever. I'll break this down and make it a little easier to digest in just a moment.
Appcues’ first PAS
I've always found examples helpful when trying to understand new concepts, so let me tell you a little bit about how we built our product adoption score at Appcues.
First, as I said, we identified the behaviors and usage patterns that would drive our product adoption score. Then we decided to apply a pretty simple binary + weights approach to our model.
The first behavior we found was that the customers who had more than a certain percentage of their users’ content in the app stuck around longer. The second pattern we spotted was in NPS surveys. We found that customers who used Appcues to field in-app NPS surveys retained better, and that was true regardless of how many users the customers had.
In both of these scenarios, we went with a binary. If they're over X percent utilization, that’s a one; if they’re under, it’s a zero. Are they using Appcues to show NPS surveys? Yes: one. No: zero.
Once we’d nailed the levers and the initial binary scoring, we knew we needed to apply some different weights, and those were based on how strongly and uniquely each lever correlated with retention.

As you can see above, we’ve got a yes/no binary column, and then a coefficient column for weighting, which then produces each piece of the score and ultimately adds up to the total score.
We tried a few different versions of this up front before we found the one that worked best. Once we had done that, we shared it with the company and worked it into our OGSM, which is very similar to OKRs for those of you who don't know it.
Putting your PAS into action
We’ve seen the science of PAS. Now let’s look at what is probably the most interesting part for those of you in customer marketing or product marketing roles – how to put the PAS into action.
At this point, you have a product adoption score, and that's really helpful, but the magic isn't in the score itself. It's in the inputs (see the leftmost column in the table above). I like to describe those inputs as a roadmap for improving retention and expansion.

You can think of the list of inputs as a checklist. These are the behaviors that you want to drive. You want to turn every customer into a one in the yes/no column, so it’s time to think about what kind of actions need to be taken inside your organization to make that happen.
If each team focuses on these components of the product adoption score, you can create some real alignment. These levers can inform customer success’ priorities and strategies. They can influence the content of your nurture programs, the cadence at which you communicate with customers, the features you spotlight inside your product, and even how you price and package your product. There's so much that you can use this for.

How Appcues uses PAS
To provide some real-world examples here, I’ll talk you through how we use PAS.
First, we use it to create alignment by providing visibility to the entire company. As I said, we include it in our OGSM. We also review product adoption scores weekly with our management team, and every month in our company-wide meetings. Our CEO also sends out weekly emails that include our PAS progress as well.
Now let’s look at the most important part – how we use PAS to drive action. We have a weekly email that provides visibility into our customers’ usage of Appcues. In that email, we have added a dynamic spot and depending on which behaviors or usage patterns you've exhibited, we’ll show you a behavior that you haven't checked off yet.
For instance, if a customer hasn't shown an NPS survey to their user base, we put an NPS ad in that dynamic spot. That's a pretty basic example, but it's driven some great behaviors from our customers.
We also used PAS to overhaul our customer nurture email program. We‘re now highlighting information or specific features that are going to encourage customers to take action on these PAS inputs.
Key features are now prioritized in our in-app nudges and guides too. Going back to the NPS example, if somebody hasn't used NPS, they’ll see a tooltip saying “NPS is a great way to do X, Y, and Z – check it out!” We're driving people to use NPS and we'll do that for all the features that we've identified as key inputs.
We even relaunched a feature that our best-retained customers were using but most of our other customers weren't because we hadn't marketed it all that well. We decided to rename it and essentially relaunch it. That improved the adoption of that feature quite a bit, which also drove up our PAS.
We launched a net-new feature too. That feature made it a lot easier to do something that used to be hard, which we knew correlated with the score. We also decided to make one of our key features available to all plans rather than gating it, which is something we used to do, because using that feature correlated with better retention.
You can drive a lot of action based on the inputs of a product adoption score. If you look at the score overall, you want to see it trending up, of course, but the most value is in the retention and expansion roadmap that the inputs create.
The results so far
What would a pseudo case study be without talking about results? While we've improved the average product adoption score quite a bit, that wouldn't matter if we didn't see an impact on retention.
Here are our logo churn and net retention results from the five quarters after we started focusing on PAS and allowing it to drive the actions across the organization. (Sorry – I had to make this pretty vague to protect proprietary information.)

As you can see, retention is stronger than ever, both by account and by revenue. We're really excited about that and we’re looking forward to continuing to iterate on the score and taking action to improve these numbers even more.


Customer marketing insider
Thank you for subscribing
Level up your customer marketing skills and connect with experts worldwide.
An email has been successfully sent to confirm your subscription.
 Follow us on LinkedIn